AGRONOMICSUPPORT
YOU CAN TAKETO THE FIELD
Weather Forecast for 2021 Planting
As #Plant21 approaches, now is a good time to take a look at the weather forecast for April – June to see the start the crop will have. The following information is from WeatherTrends360, which provides an 11 month forecast with 80% accuracy. Keep in mind, it’s called WeatherTrends for a reason. It provides insights into the trends we can expect to see in climate, rather than a day-to-day forecast.
April Forecast
The precipitation maps for April of 2021 are below. The map on the left shows predicted precipitation for April 2021, versus the actual precipitation received in 2020. In this map you’ll see the High Plains region is expected to receive some much-needed precipitation. The prediction is for more than 200% of the precipitation received in 2020. Even though the High Plains Region looks to be wet with a 200% increase over last year, when you evaluate actual precipitation amounts on the map on the right, the total amount received will be 1 to 2.5 inches. It’s better than nothing, but it won’t relieve the High Plains of their current drought conditions.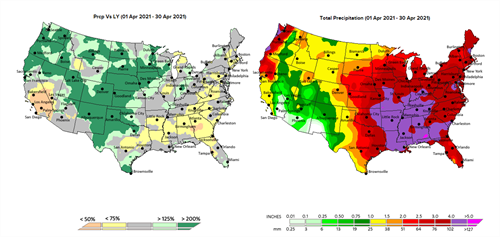
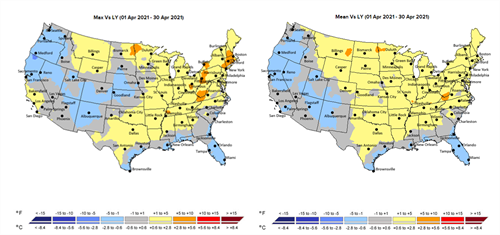
When it comes to evaluating temperatures in April, it is important to look at the forecasted low temps to ensure temps won’t drop too cold for plant and seedling health. However, the max temperatures show an interesting trend for the year ahead. Maximum temperatures in April predict that much of the eastern half of the United States will be warmer, while the western half will be much cooler. When it comes to average temperatures (mean temperature), WeatherTrends360 is predicting warmer averages for much of the country. This is helpful to know, because now you can assume that most of the low temperatures this year will be, on average, warmer than last year. This trend should bring warmer early soil temps at planting.
May Forecast
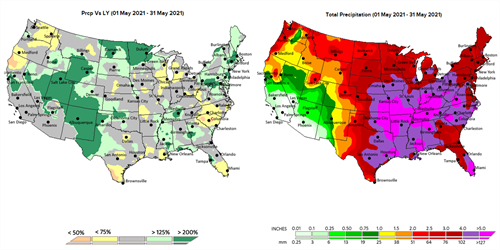
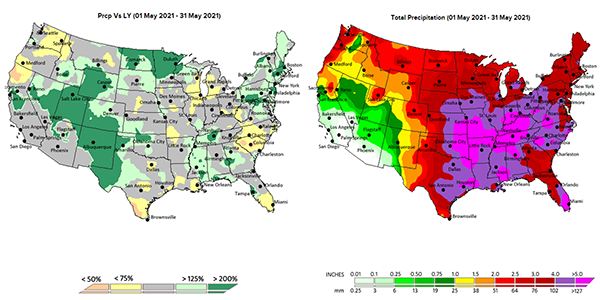
Now that we know what to expect in April, let’s take a look at what May could bring. We’ll look at the same two maps, actual precipitation last year vs the precipitation forecast. Again, WeatherTrends360 predicts much-needed moisture in the west, although still not enough to break the drought cycle.
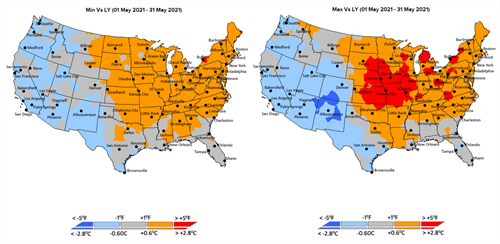
Below are the minimum and maximum predicted temperatures compared to actual temperatures in 2020. There appears to be a great divide from east to west, with temps much warmer than last year in most of the eastern half of the Unites States and the opposite case in the west. There also appears to be a significant warming trend in the very center of the U.S. Much of the corn belt is trending towards very favorable growing conditions in April and May.
June Forecast
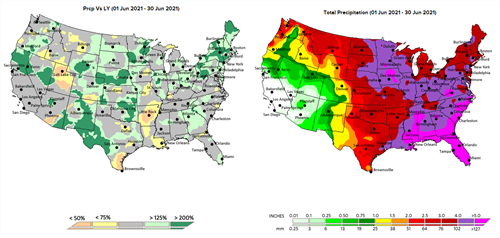
When we move into June, the maps become less predictable. Because these maps compare 2021 to 2020, and 2020 had extremely scattered precipitation events, the maps show exactly that: a somewhat scattered prediction. However, if you take a look at the total precipitation forecast map on the right, you’ll see that much of the eastern half of the U.S. will be in a wet pattern, and those in the High Plains could get some relief from drier conditions with significant precipitation in much of that area.
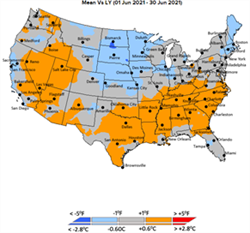
Temperature predictions in June are also drastically different from 2020. In 2020 there was a high-pressure area that seemed to set in the north central part of the United States, and it brought some above average temperatures with it, for the entire month. In addition to that, it brought several high-wind events as the system passed through. The 2021 vs 2020 Mean Temperature Map (left map below) shows a cooler year coming, but because June 2020 was somewhat of an anomaly, let’s take a look at the actual minimum and maximum temperatures expected for this coming year, to get a more complete picture.
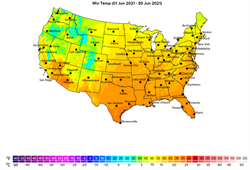
When it comes to June temperatures, it’s important to look at the minimum temperature maps, which is generally a correlation to nighttime temperatures. When nighttime temps start reaching that 75-degree range, it makes it harder for corn plants to respire at night.
Take a look at the June Mean vs Last year map and relate that to the Min Temp map above it – you’ll see that much of the South and Southeastern part of the country is expected to be on a warmer trend.
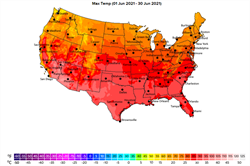
Now, take a look at the max temps for June and you’ll notice that much of the southern half of the United States will be quite warm when it comes to daytime highs.
For much of the Corn Belt, the spring weather predictions look favorable. However, with every spring there will be areas where the weather is less than ideal. This information is a great overview and starting point to reference while you create field-by-field plans.
However, having access to all this data isn’t helpful unless you know what to do with it. The Mix Matters Tool makes the most of data like this for you, as it factors the 11-month forecast from WeatherTrends360 into every hybrid recommendation it makes. Download the Mix Matters Tool to find the right hybrids for weather conditions in the year ahead.





Technical Team Agronomist